Bim-driven Whole Buiilding lca

Tally 2.0 is here,
and smoother than ever.

We've rebuilt Tally from the bottom up to use newer data, an expanded library of takeoff methods, and to lessen the burden and increase the accuracy of BIM-based life cycle assessment.
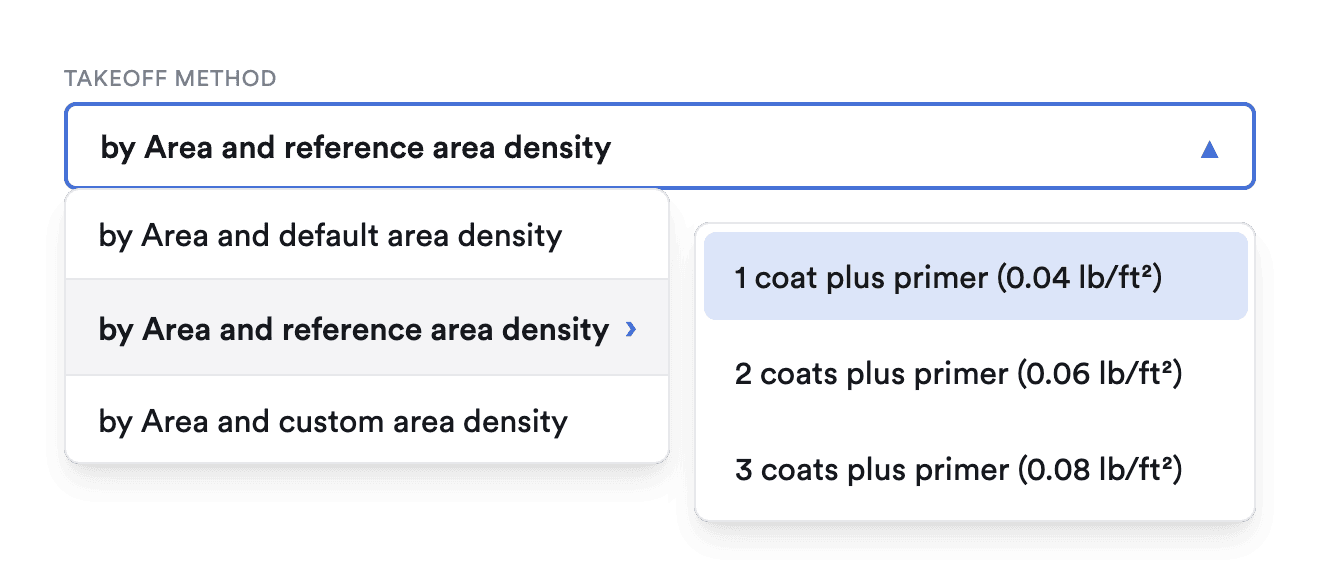
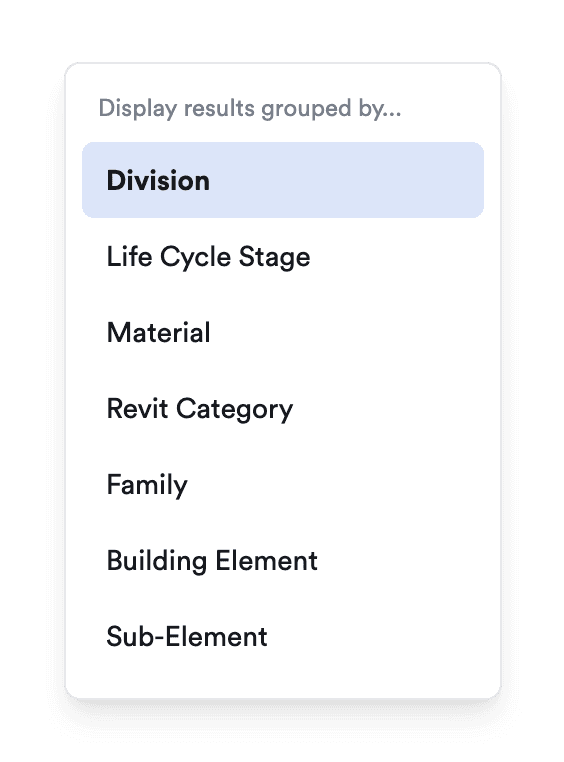
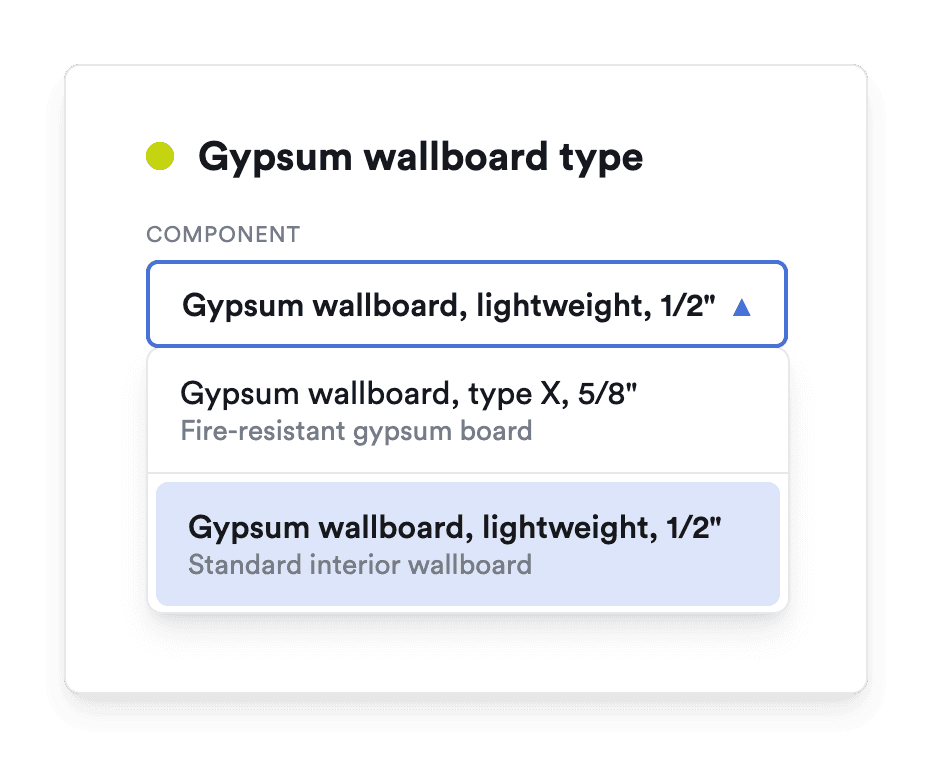
Dropdown menu labeled 'Takeoff Method' with options 'by Area and default area density,' 'by Area and reference area density' selected, and 'by Area and custom area density.' Next to it, another dropdown lists coating options with weights: 1 coat plus primer (0.04 lb/ft²) highlighted, 2 coats plus primer (0.06 lb/ft²), 3 coats plus primer (0.08 lb/ft²).Dropdown menu titled 'Display results grouped by...' with options: Division (selected), Life Cycle Stage, Material, Revit Category, Family, Building Element, and Sub-Element.Dropdown menu titled Gypsum wallboard type with two options: Gypsum wallboard, type X, 5/8 inch described as fire-resistant gypsum board, and Gypsum wallboard, lightweight, 1/2 inch described as standard interior wallboard, with the lightweight 1/2 inch option selected.
Give Yourself the whole picture

Material impact assessment integrated directly in your BIM environment.

Track materials and impact data holistically as you model, sync'ing your choices from the model directly to the firm-wide portfolio and back again

Get answers fast

With Tally 2.0, there's no more waiting to complete the analysis before running the report. Results are generated as you design, connected directly to the elements in the model.

Tally 2.0 handles linked models and standalone models with equal ease, allowing multiple paths to better collaboration across the project team.
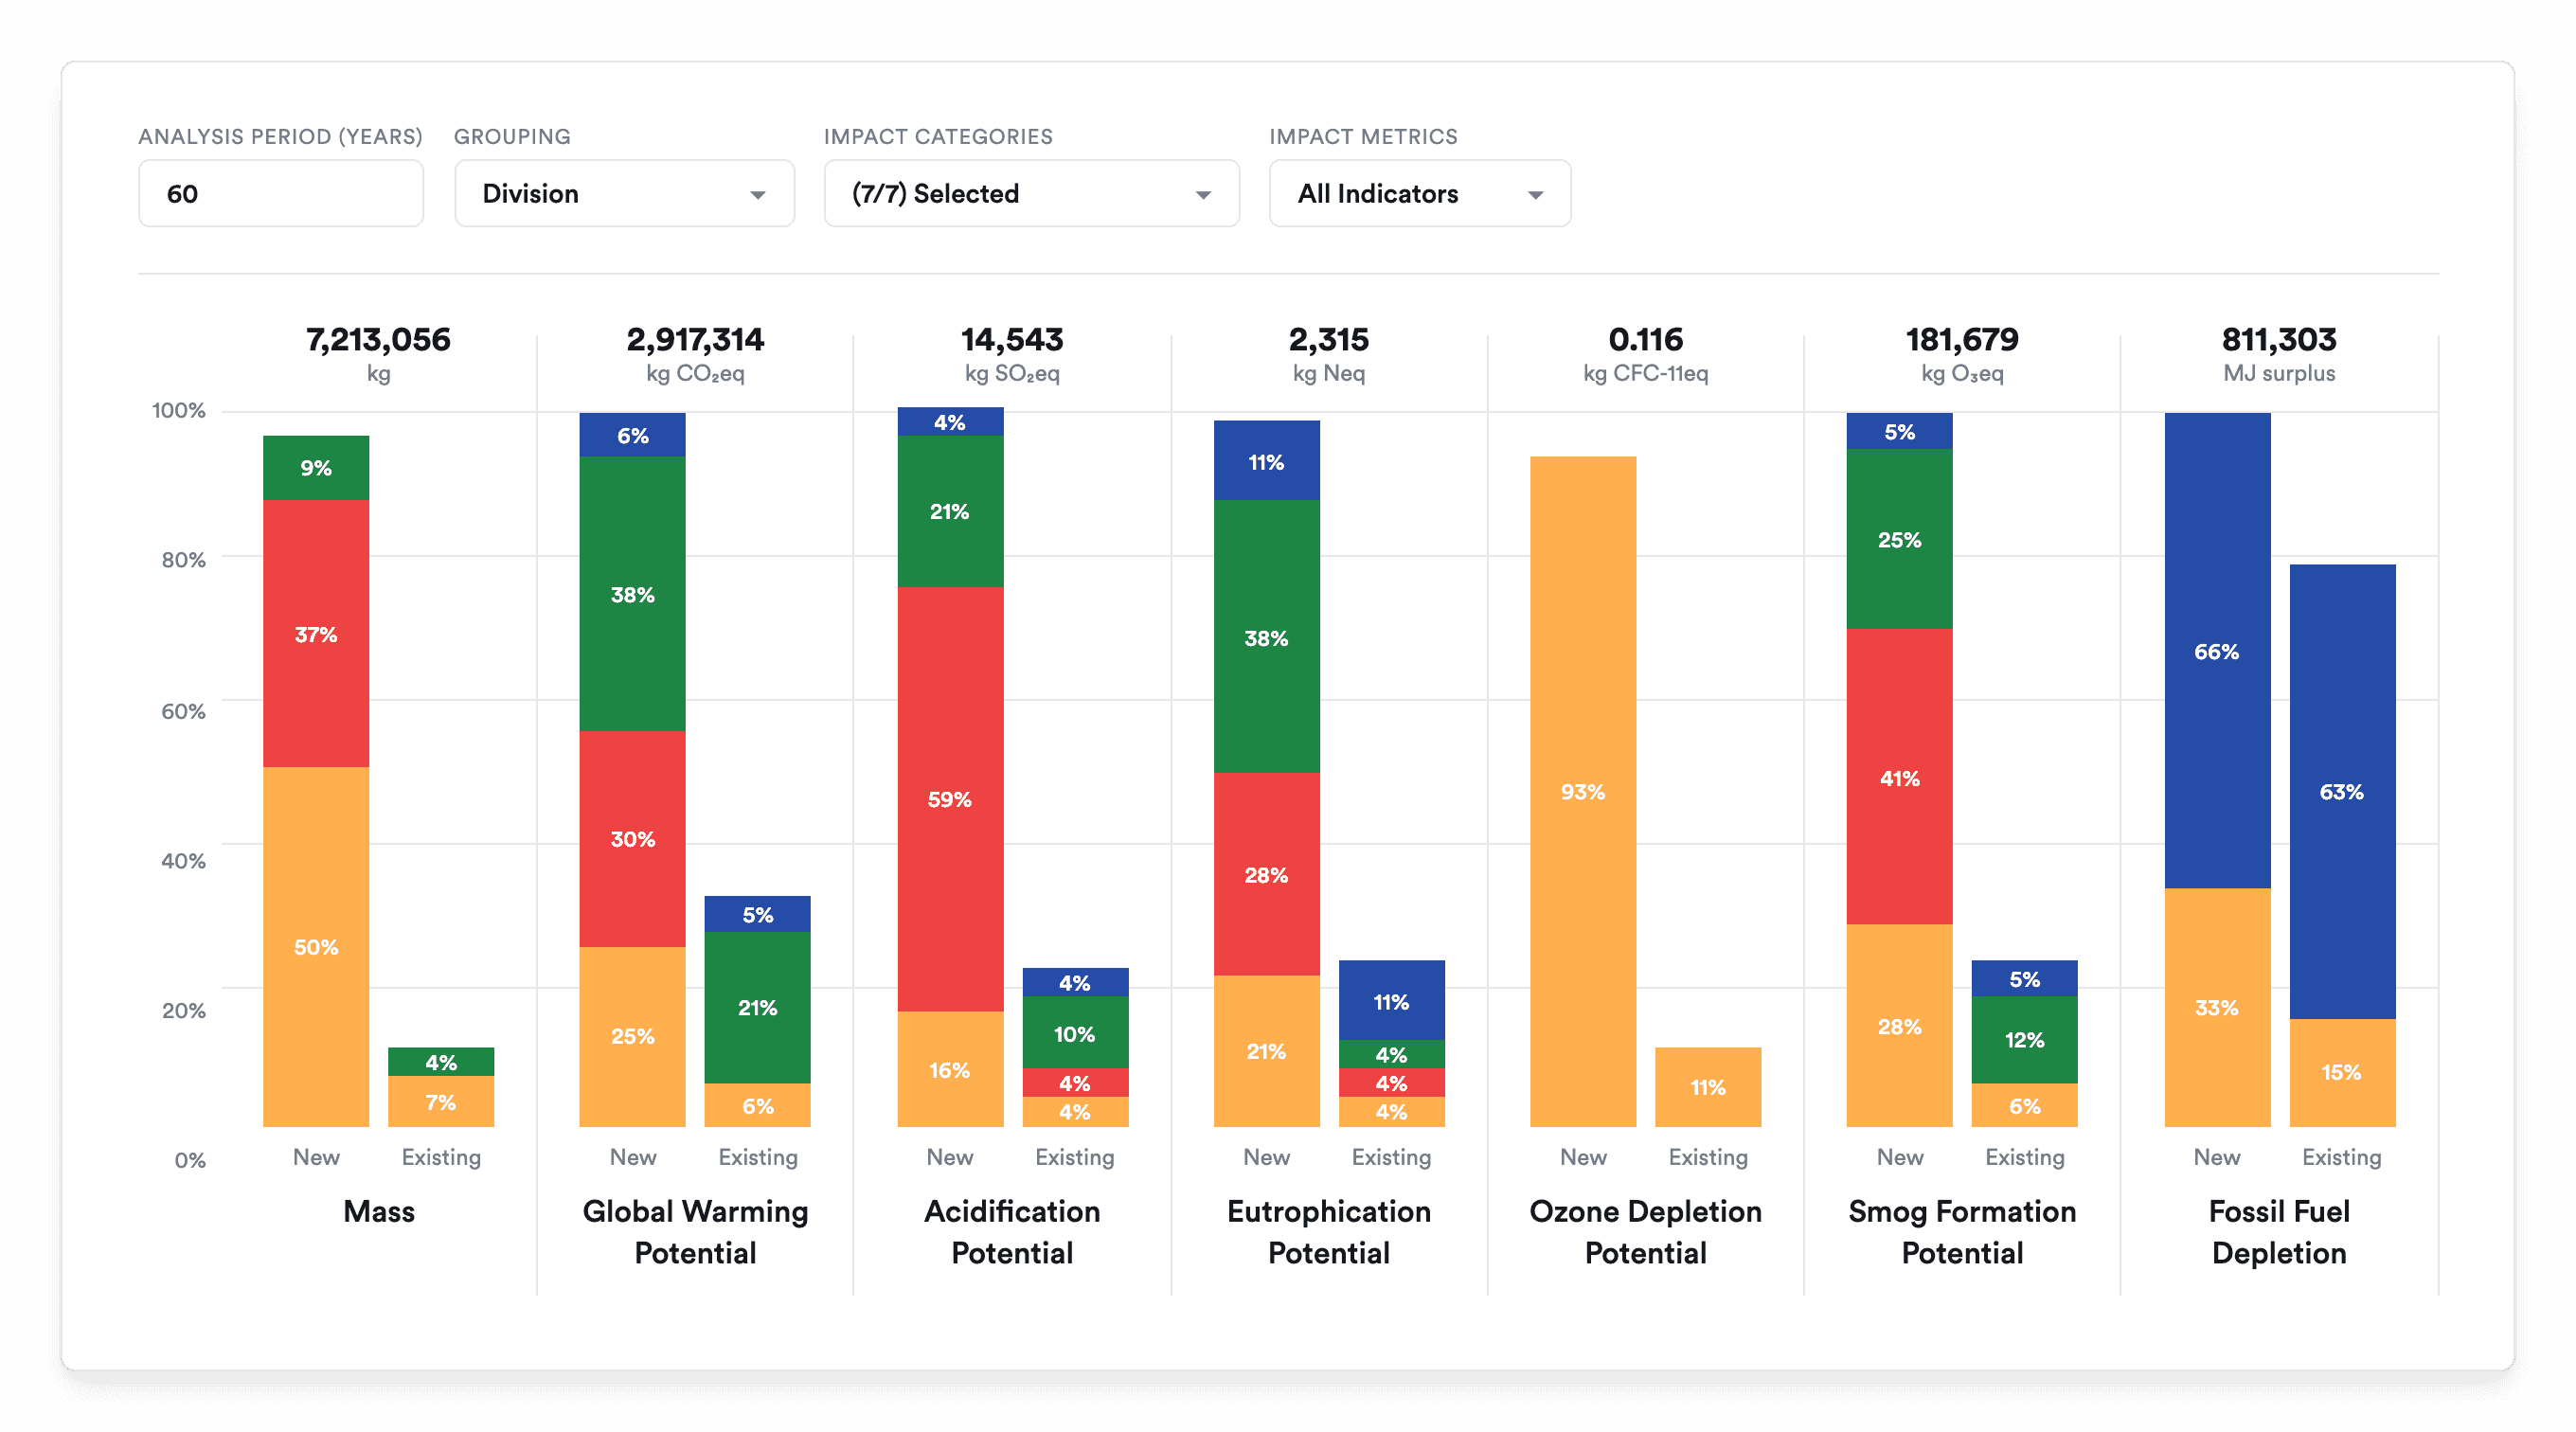
Stacked bar chart showing environmental impact comparison of new versus existing division over 60 years across seven categories: Mass, Global Warming Potential (kg CO2eq), Acidification Potential (kg SO2eq), Eutrophication Potential (kg Neq), Ozone Depletion Potential (kg CFC-11eq), Smog Formation Potential (kg O3eq), and Fossil Fuel Depletion (MJ surplus). Each bar is divided into color-coded percentage segments representing contributions. New division shows higher percentages in Mass, Acidification, Eutrophication, Ozone Depletion, and Smog Formation, while existing division has relatively lower impacts except Fossil Fuel Depletion where the new division shows a larger share.
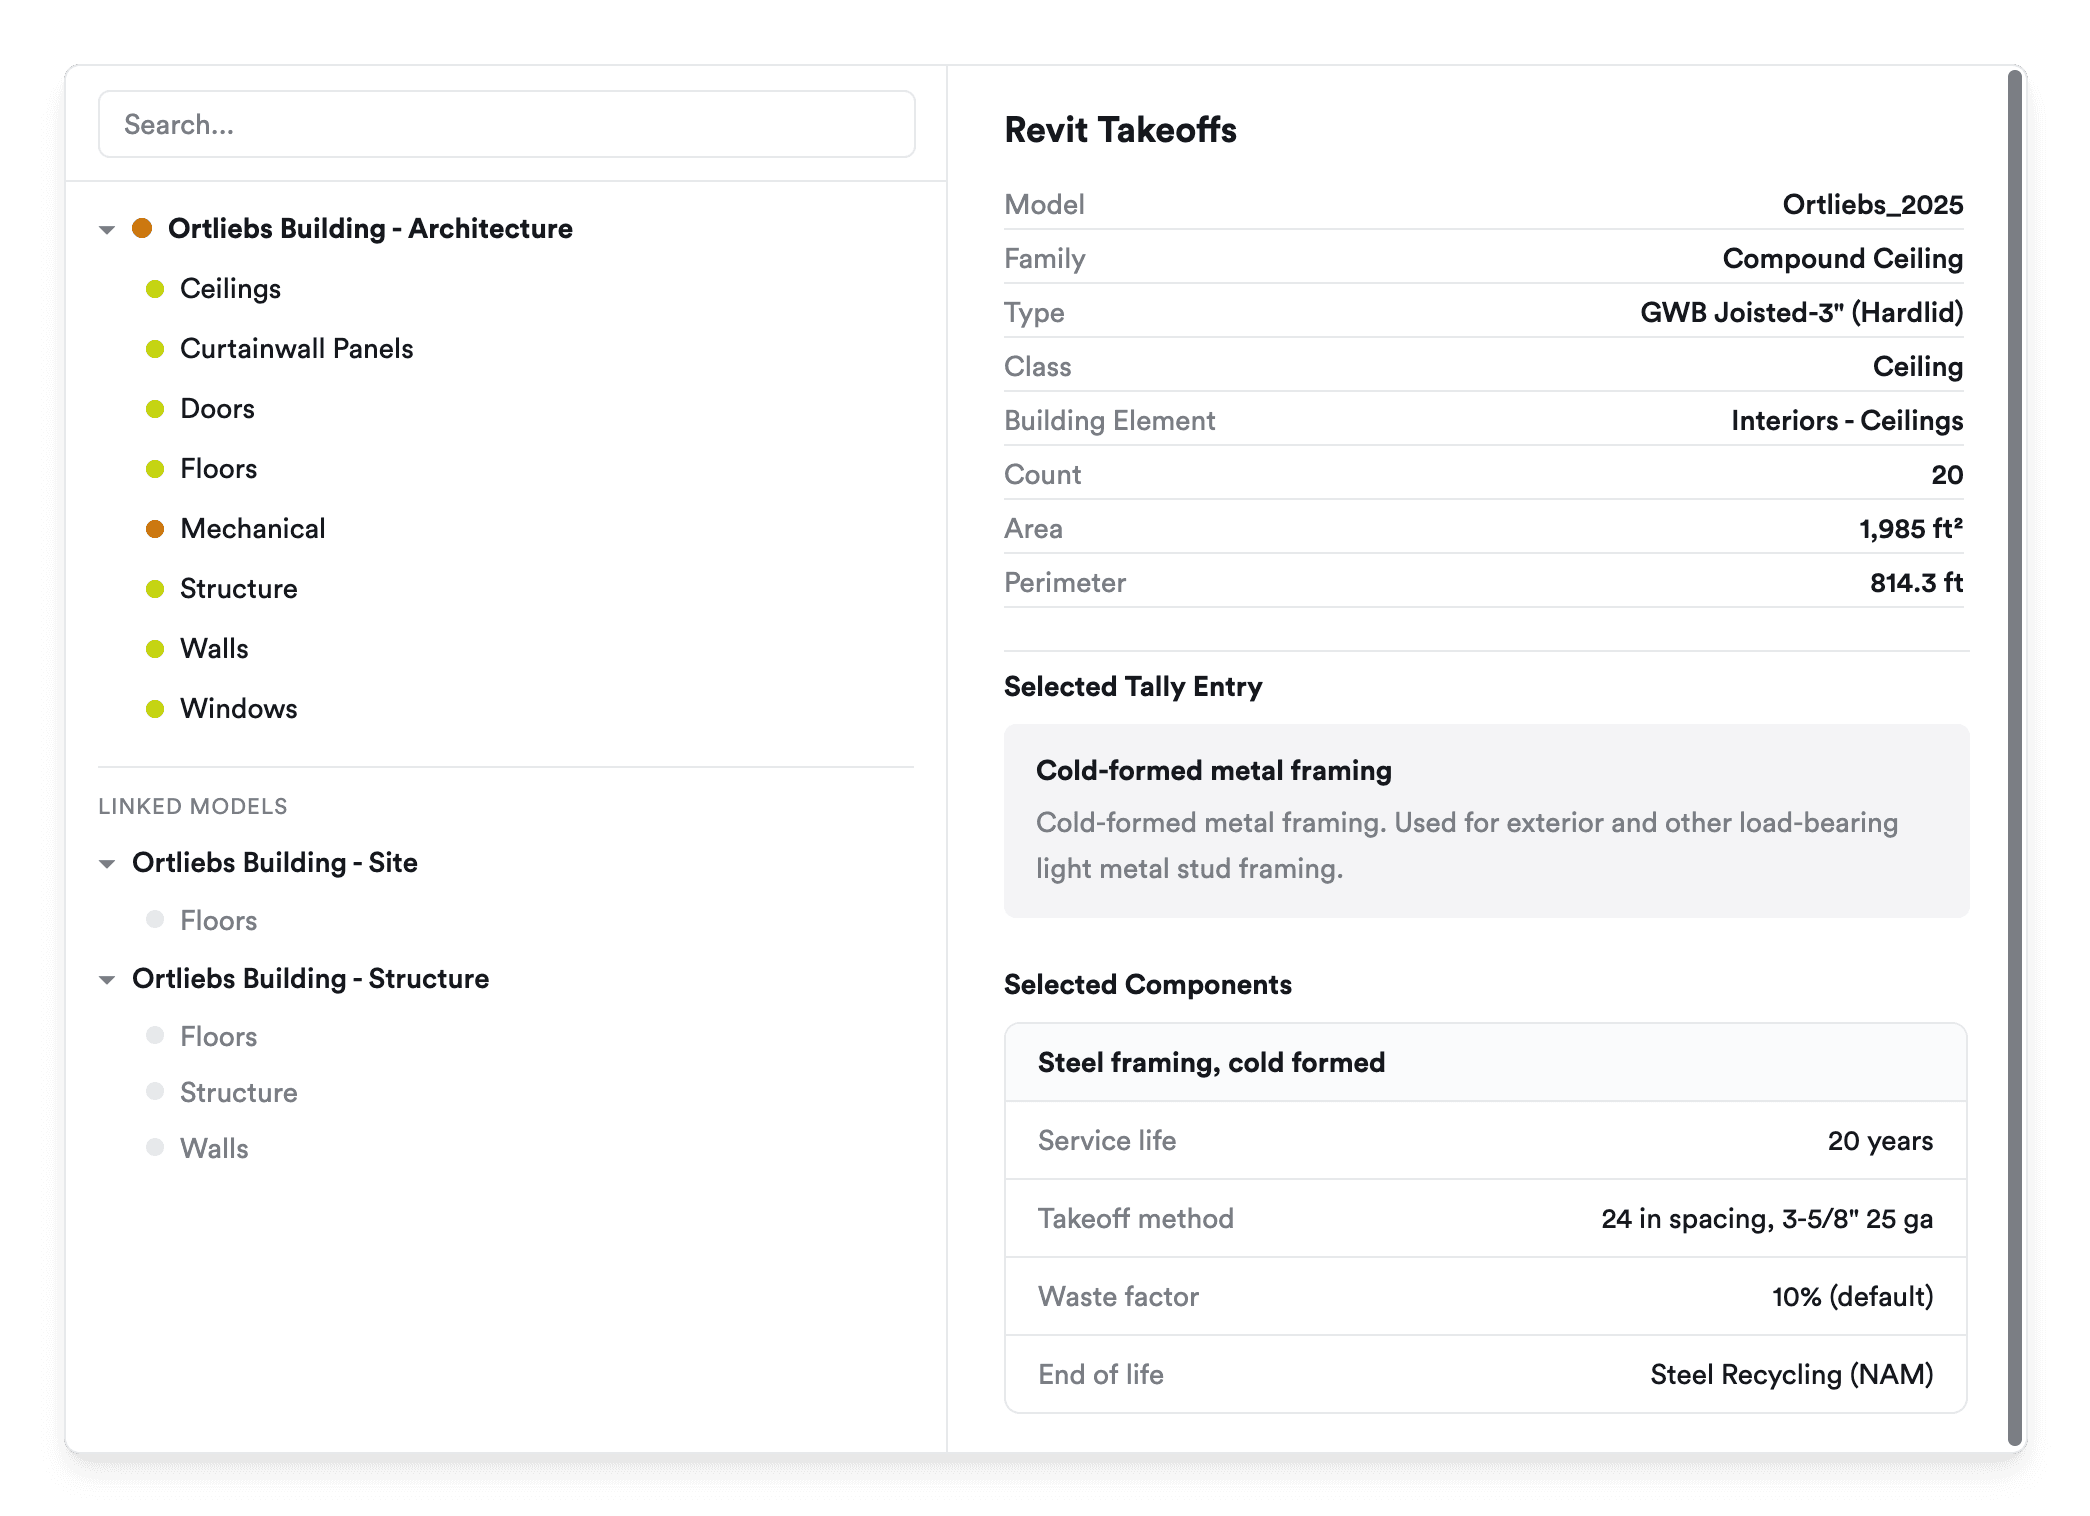
Screenshot of a Revit model explorer interface showing details of a compound ceiling model named Ortliebs_2025 including count, area, perimeter, and cold-formed steel framing components with service life, takeoff method, waste factor, and end of life recycling info.

New data, better methods

The impact and supply chain data within Tally 2.0 has been totally rebuilt to bring the tool up to date with current practices. This data update will allow users to use product-specific EPDs within the calculation.

"Tally 2.0 strengthens data continuity from early design through construction by putting credible, trackable data within reach for more teams and more projects."

Headshot of a middle-aged man with a bald head wearing black rectangular glasses, a dark blazer, and a blue collared shirt against a dark blurred background.

Marty Brennan

Principal @ ZGF

Door symbol

Are you ready to maximize
the positive impact
of your projects?