
Benchmark your portfolio
Use portfolio data to drive insights and accountability.
Build custom portfolios, view normalized project whole life carbon emissions side-by-side, and compare results.
Add projects to your organization’s account today!
Portfolio-level Insights
Organize and analyze projects however you’d like.
Use tags to define collections of buildings for internal knowledge-sharing and client-facing presentations.
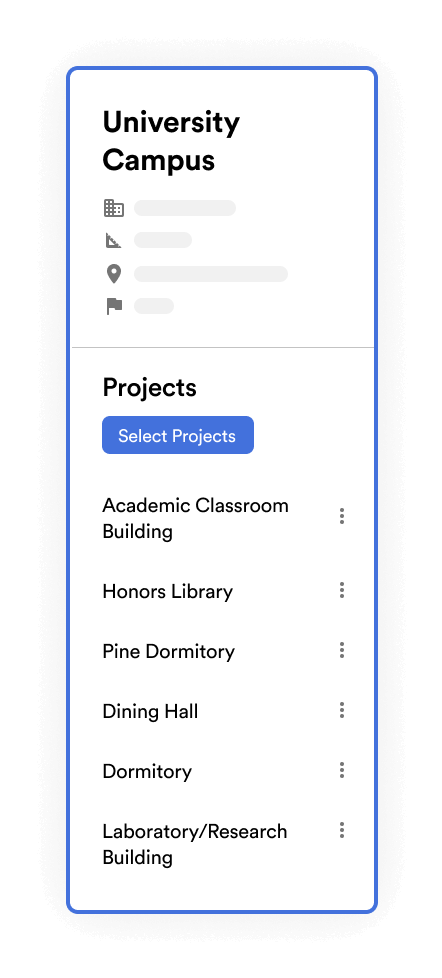
Create custom sets of projects
Manually group projects to create a portfolio for a specific client, planning project, or assembly of buildings. Flexibly add or remove projects at any time.
.png)
.png)
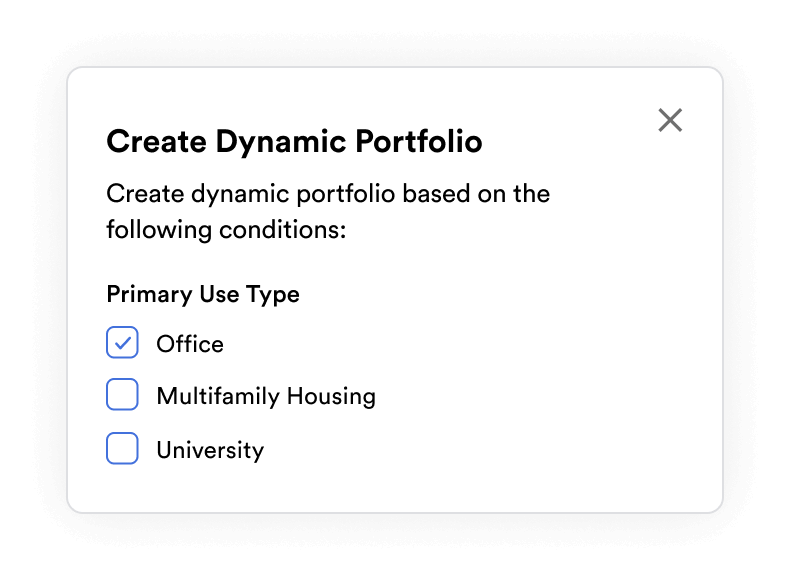
View portfolios by type
Create filtered lists that update automatically as you add new projects. Want to analyze all your K-12 School projects? Just set the filter, and your portfolio stays up to date.
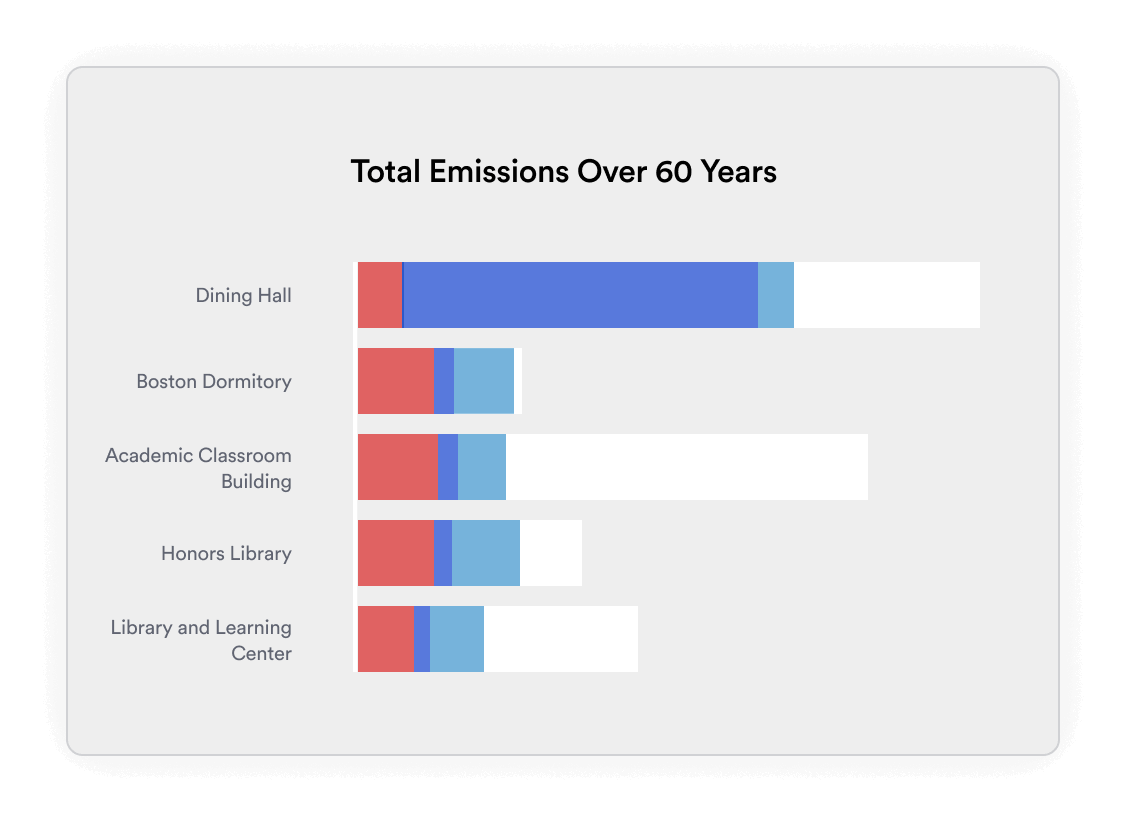
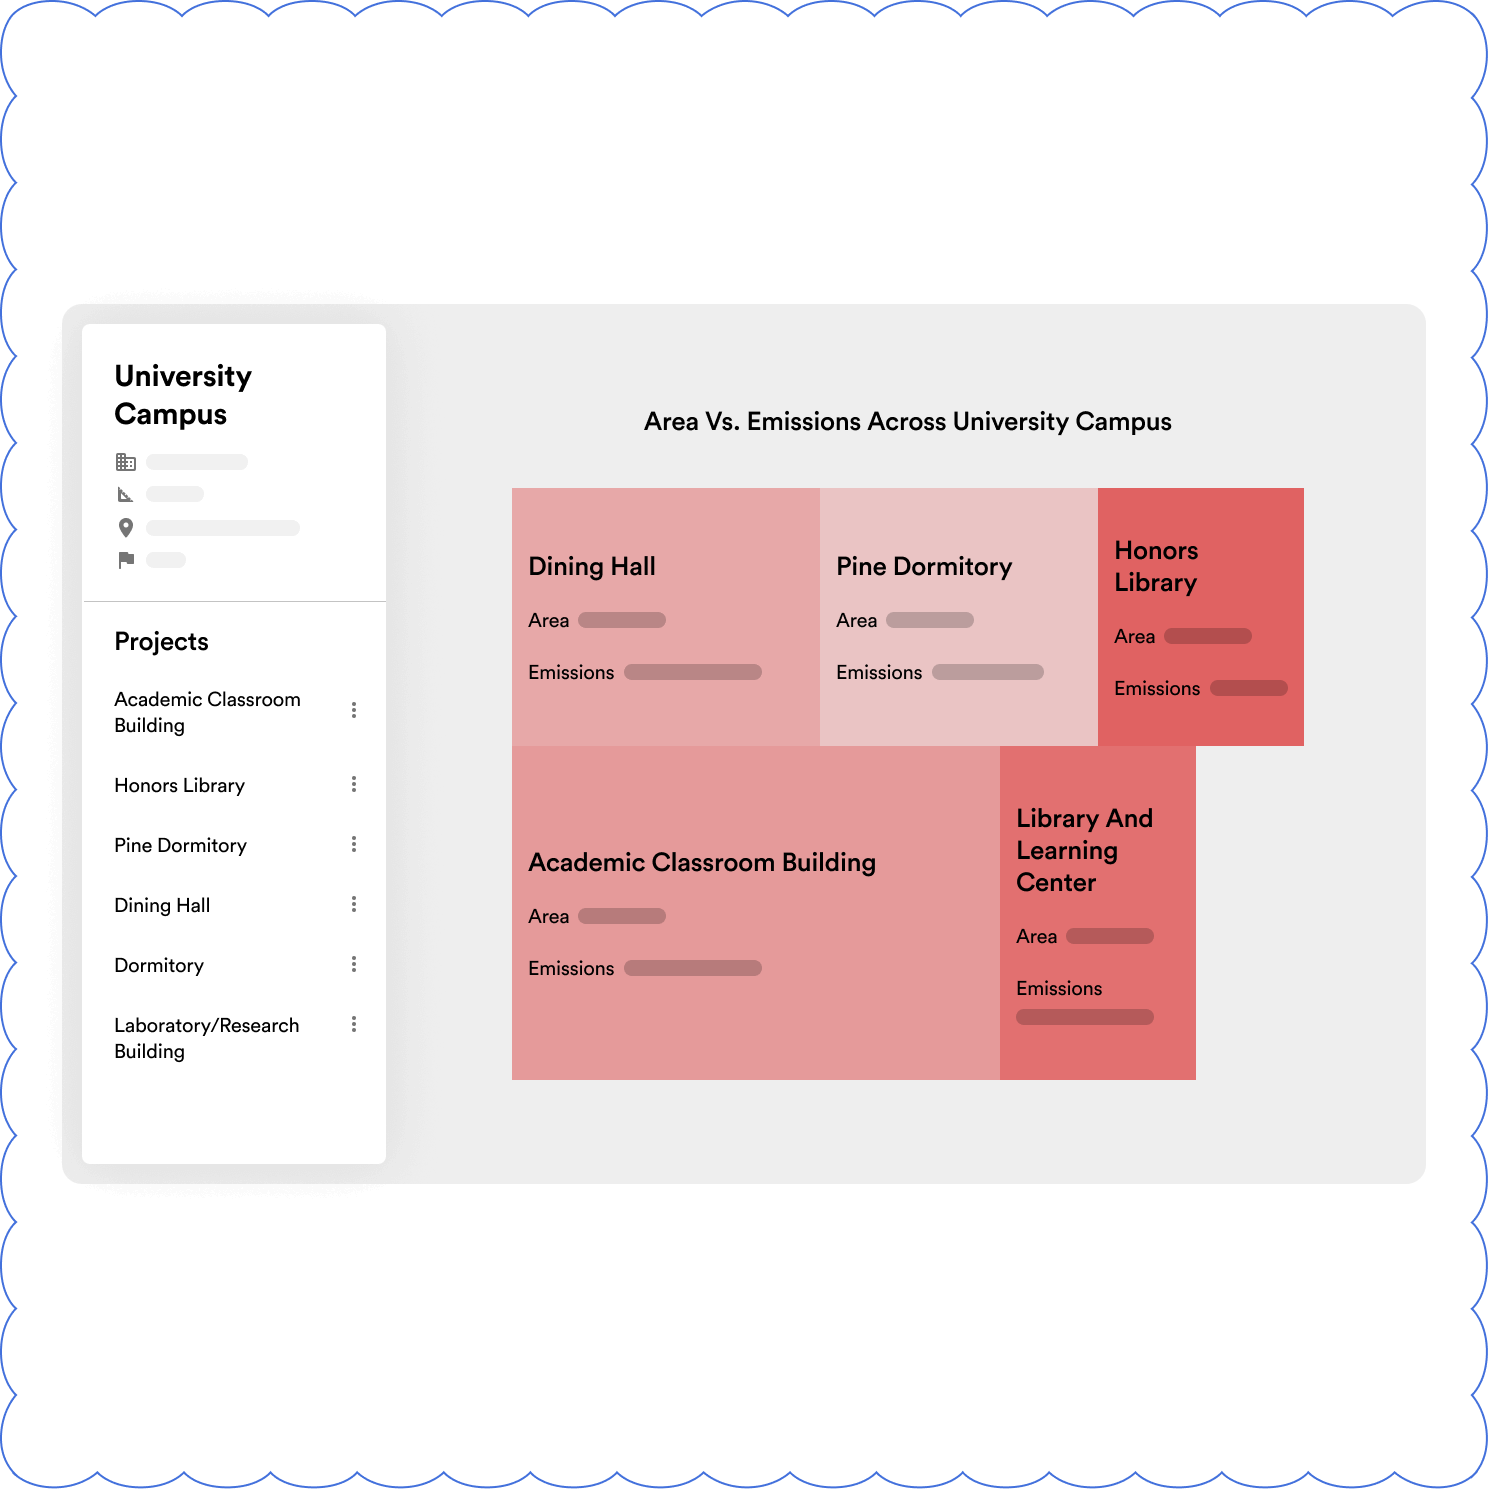
Visualize it your way
Toggle between absolute and relative emissions. View projects in tree maps to explore area vs. total emissions. More graphical options are added regularly, as well as comparisons to industry benchmarks.
“The organization-wide version of C.Scale supports our goal to ‘raise the middle’ and engage all of our project teams. We want to know what the levers are that will improve a building’s carbon emissions. C.Scale makes getting these answers intuitive and easy.”

Mara Baum, FAIA
Partner @ DIALOG

Ready to integrate decarbonization into your design workflow?
Talk to a founder at a time that works for you